
Eye tracking is a practice with over a hundred years of history. Great changes have been made since the first follow-the-speck-on-the-eye methodology, and most setups now involve simply sitting comfortably in front of a candy-bar-sized tracker. While it’s clear that the hardware has become easier to use, faster, and better, the software has also undergone many changes.
The history of eye tracking software doesn’t stretch back as far as the hardware, but it shows a similar arc – starting with rudimentary but functional solutions and leading to where we are today – easier-to-use, faster, better. Whereas the software would previously provide only the raw data essentials, it’s now possible to go much further with a few clicks.
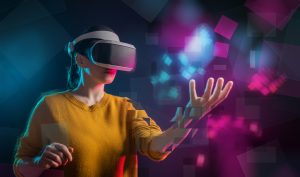
iMotions offers a fully-flexible platform for human behavior research, including software modules for screen-based eye tracking, eye tracking glasses, and eye tracking in VR (and well beyond). Below, we’ve set out the principal components of what our screen-based eye tracking module can do. We might not have every possible software feature (we can’t send you to the moon (yet), and we’re still working on that “conclusion” button), but we’d like to think we come pretty close. If you’d like to learn more, and get the full picture of the software, reach out and talk to one of our experts.

Integrations
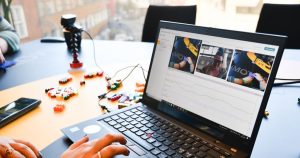
It’s possible to connect over 30 different screen-based eye trackers to the iMotions software. This includes trackers from leading companies such as Smart Eye, EyeTech, and Gazepoint, but also eye trackers from companies that have now been acquired and no longer produce hardware (e.g. SMI, but also others). This provides a great range of flexibility depending on your needs – whether it’s sampling rate, accuracy, coverage, or cost.
The software provides the same functionalities for all screen-based eye trackers, meaning that it’s possible to carry out analysis methods like gaze-mapping even if this isn’t standard for the eye tracker in question.
Gaze mapping
Gaze-mapping is the process in which dynamic visual stimuli – such as a website – can be converted into a single image upon which the gaze of multiple participants can be aggregated. It provides a single view from which heatmaps can be generated, and other metrics can be calculated.
This analysis method helps when trying to understand the viewing habits or attentional processes of multiple viewers, even if they view the stimulus in different ways at different times. (We have a blog post that explains some of the fundamentals of gaze mapping here).
Complete experimental platform
Almost every step in the experimental process is covered in iMotions – from experiment design (stimuli order, participant details, grouping), to stimuli presentation (more on that below), to data collection, processing, and export. Depending on your needs iMotions may also offer all of the analysis capabilities that you require – heatmaps and gaze/fixation replays (both for single and groups of participants) are automatically generated.
This means that the entire experiment can be carried out in iMotions – there is no need for differing software running stimulus presentation, eye tracker recording, or keeping track of participant groups. This makes the process particularly streamlined and easy to run when running experiments with multiple participants.
Stimulus types
The screen-based eye tracking module allows for tracking when viewing any screen-based stimuli. This includes images, videos, websites, games, software – whether on a desktop, tablet, or mobile phone. This means that participants can be tested for their visual responses to virtually anything – whether it be calculating the number of fixations a physician makes to assess an X ray scan on a screen, a heatmap from consumers viewing new product designs, or the blind spots players show when completing a game.
Data and analysis
iMotions provides a range of data outputs that help assess the visual attention of participants. This includes the prerequisite fixations, gaze points, and heat maps, but also various calculated metrics. (We have a blog post that covers many of these metrics here).
Some of these metrics include the first fixation duration, the average fixation duration, and the ability to create areas of interest (AOIs). AOIs can be placed as a shape in whichever form desired over any stimulus – whether an image, or video, game, etc. These provide information that includes the following (in milliseconds and / or percentage):
- TTFF
- Time spent
- Ratio
- Revisits
iMotions also provides data provided by the eye tracker. For example, the coordinates of the eye positions, the distance of the viewer, or the amount of pupil dilation. A new R notebook will also carry out blink detection, based on data coming from the eye tracker. There is also synchronized information about computer use, such as mouse clicks and keystrokes, particularly useful when relating computer interaction to biosensor data.
Not all data is created equal – there may be parts of the analysis which should be left out, or looked at in more detail. Perhaps you only want to export certain parts of the data while ignoring the rest. iMotions provides an annotation tool that can be used either live as data-collection occurs, or following data collection. It’s straightforward to mark up the data and select specific segments for processing or export.
Further integrations
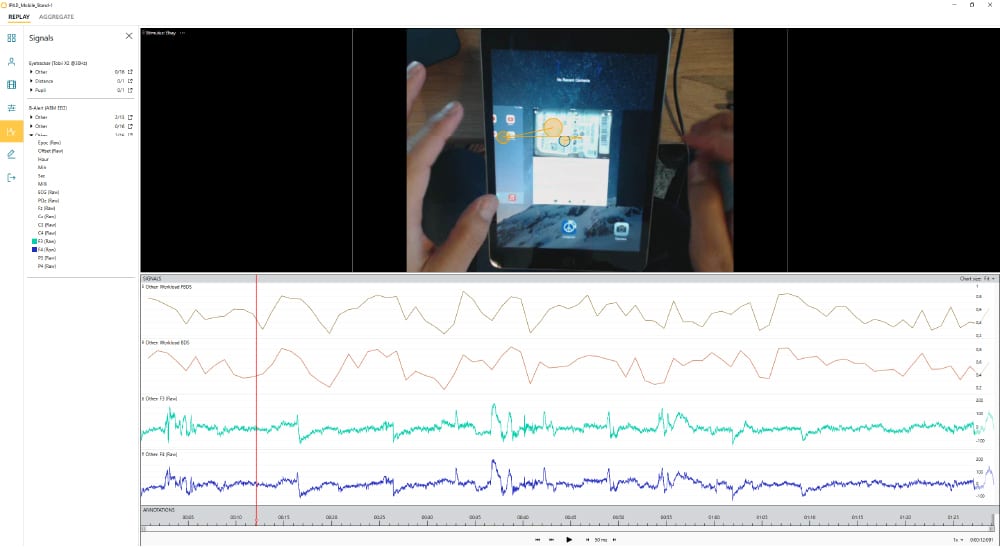
iMotions also provides the possibility to connect multiple, different biosensors together in order to create a deeper analysis of human behavior. Biosensors such as facial expression analysis, EDA, EEG, ECG, and EMG (among others) can be seamlessly included in the experiment.
These sensors can complement the data by providing a depth of understanding that is otherwise missing. The data can provide information about emotional expression, physiological arousal, or brain activity, which is not available when considering eye tracking data alone.
It’s also possible to connect a variety of other sensors that aren’t natively integrated by using the Lab Streaming Layer (LSL) protocol. This allows data from other sensors to be sent in to iMotions and synchronized with other data sources (a list of LSL supported devices and tools is available here).
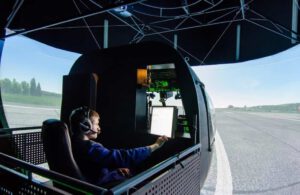
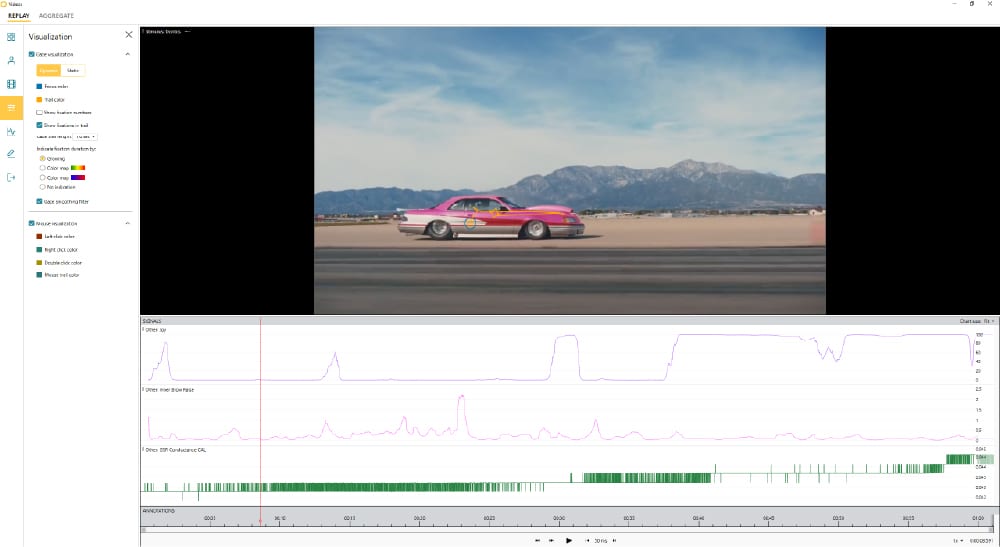
Beyond this, it’s also possible to use the open API to connect essentially any other datastream. This is used to, for example, feed-forward data obtained from a car in a driving simulator so that visual responses can be correlated with braking speed. Virtually any data-producing device can be connected into iMotions, creating new research possibilities.
Mobile phones/tablets
Screen-based doesn’t have to mean just desktop monitor. With over 50% of internet usage being carried out through a mobile phone, and tablets being increasingly used, there is a clear need to test participants on a device other than a desktop screen. It’s possible to connect, and calibrate the eye tracking to, virtually any mobile phone or tablet. This allows user responses to be examined regardless of the device of choice. The same stimuli types can also be recorded, even when presented on a mobile device.
Export and visualization
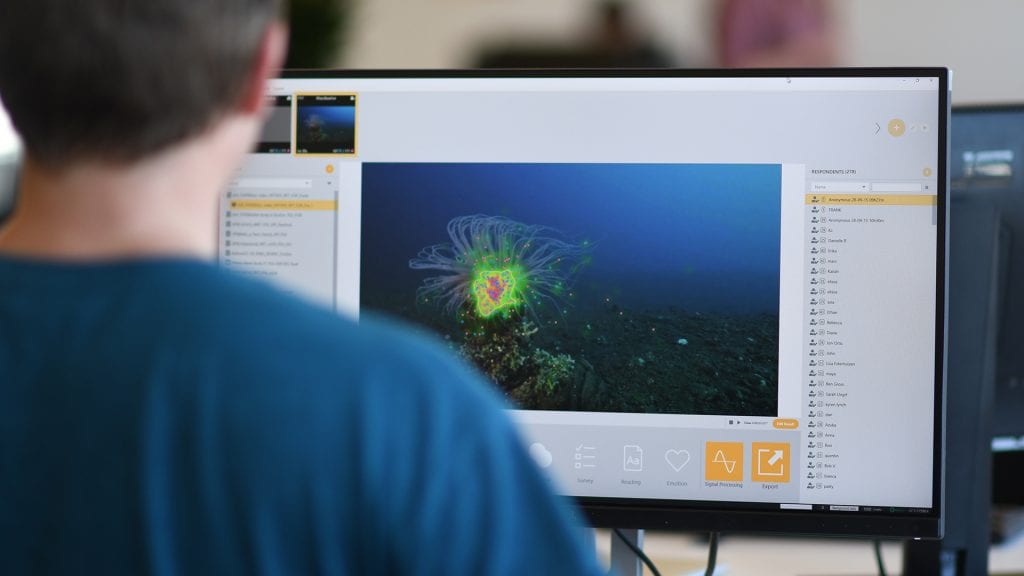
Experiments never finish at the data collection stage – analyzing the data allows for the hypotheses to be tested and information to be gathered. iMotions allows the data to be exported easily for further analysis if required. The data can also be viewed inside an intuitive user interface – the recording of the stimulus can be exported showing the gaze and fixation data as a static image or video file. Annotation and markup allow specific segments to be selected as desired.
It’s possible to choose exactly which sensor data to export together, meaning that while a large amount of data can be collected, the data that you regard as superfluous (for example, the battery amount remaining for an EDA device) need not be exported in the same file. You can therefore export the data you need, to do the analyses you’re after.
Conclusion
The points above cover the main features available in the screen-based eye tracking module, however there is more to each and every piece. If you’d like to learn more about how this module is (or isn’t!) right for you, then reach out and discuss with our experts, or download the brochure below.